This page contains example content for previewing or demonstrating computational content and notebooks, as well as Thebe integration.
Pandas
import pandas as pd
import numpy as np

df = pd.DataFrame(np.random.randn(10, 4), columns=['A', 'B', 'C', 'D'])
df
Loading...
Matplotlib
import matplotlib.pyplot as plt

plt.figure(figsize=(10, 6))
plt.scatter(df['A'], df['B'], alpha=0.7)
plt.xlabel('Column A')
plt.ylabel('Column B')
plt.title('Scatter Plot of DataFrame Columns')
plt.grid(True, alpha=0.3)
plt.show()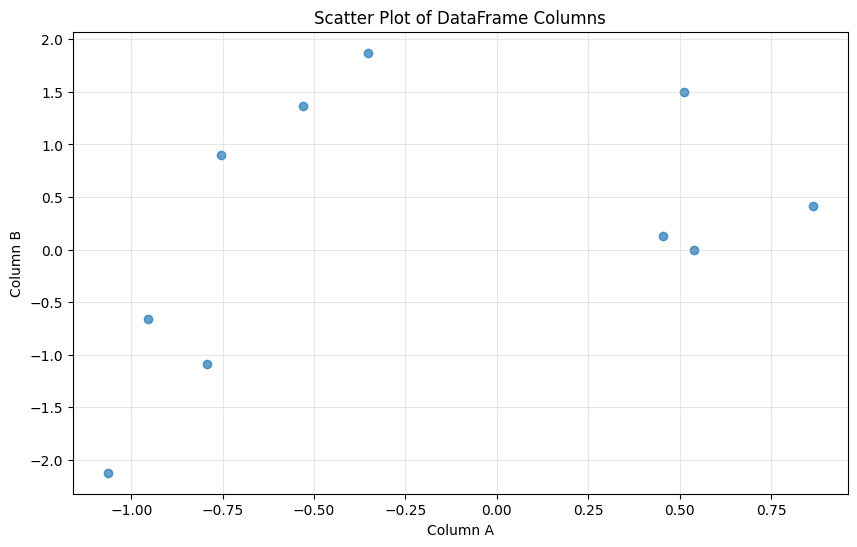
Plotly
import plotly.express as px

fig = px.scatter(df, x='A', y='B', title='Interactive Scatter Plot with Plotly')
fig.update_layout(
    xaxis_title='Column A',
    yaxis_title='Column B',
    showlegend=False
)
fig.show()
Loading...
Altair
import altair as alt

chart = alt.Chart(df.reset_index()).mark_circle().encode(
    x=alt.X('A:Q', title='Column A'),
    y=alt.Y('B:Q', title='Column B'),
    tooltip=['index', 'A', 'B']
).properties(
    title='Interactive Chart with Altair',
    width=400,
    height=300
)

chart
Loading...
Bokeh
from bokeh.plotting import figure, show
from bokeh.io import output_notebook

# Configure Bokeh to display plots inline
output_notebook()

# Create the plot
p = figure(width=400, height=300, title='Interactive Scatter Plot with Bokeh')
p.scatter(df['A'], df['B'], size=8, alpha=0.7, color='navy')

# Customize the plot
p.xaxis.axis_label = 'Column A'
p.yaxis.axis_label = 'Column B'
p.grid.grid_line_alpha = 0.3

show(p)
Loading...